Archive by Author

The Most Elaborate Weekend Project of My Life: Why I Built, Maintained, and Sold Sports.ws

1 Jan 2013

I have vivid memories of getting excited about the Sunday edition of the Chicago Tribune as a kid. It listed every baseball stat for every player on every team. I think I spilled more Honey Nut Cheerios on sports pages than I actually ate. I liked playing baseball like any red-blooded American boy, but I think I liked it the same way Nate Silver does today, because it has more data points that just about anything in history.

My Best Friend in 1988: Earl Weaver Baseball

I knew about Rotisserie baseball and how you could simulate your own games with friends, but damn if I was going to wait more than a week to get back results in the mail. I tried Strat-o-matic and Earl Weaver for Apple ][, but there was something about playing with a big group of friends that was most appealing about the potential of "fantasy" baseball.

I made up rules and manually scored a league for my friends early in high school. I can't say it made me the coolest kid in school, but it was fun. Don't worry, I still got chicks because I played trombone and was in advanced math.

League Zero

In college I met two things that changed me. The first was a dude on the track team named Jeffers who was named after a poet, was way more worldly than me, wore dog collars, and dyed my hair obscene colors on the regular. The second was the Internet.

In our college cross country coach's basement, we decided we needed something competitive (other than the running) to keep us busy for the winter. Jeffers wanted to start a fantasy basketball league from scratch. In 1994, the Internet wasn't much. But, we had "high" speed dorm connections and I'd had some luck building a joke (at first) Vlade Divac Fan Club that was featured on Yahoo!'s first What's Cool list and later on actual NBC TV.

The First Boxscore

Fantasy sports were coming into existence online, but only baseball and football were available, and they certainly weren’t mainstream. So we had to invent our own rules for basketball. We counted +1 points for the big categories (points, rebounds, assists, steals, blocks), let each team start one player at each position, have a sixth man, then two more count half-points. Two more on the roster could ride the pine. We added a one-point advantage/disadvantage for home-court. One catch: if a player didn’t play at all, the next in line would sub-in automatically (maybe the most important rule we added). If you play today, you’ll notice it’s a very crude version of the default game Sports.ws offers.

Rethinking Fantasy Sports

If you’re not versed in fantasy sports, you may wonder what the big deal is. Why so popular? Here’s my view: it’s the ultimate way to keep score. Take NFL Football and think about how many millions of hours are wasted spent watching games every Sunday. When friends watch together, the banter between plays usually revolves around what will happen next and postulating what the coaches, players, cheerleaders, trainers, and groundskeepers are thinking. There’s no score, it’s just argumentative fun. Fantasy sports is a way to keep track of this: winning is a proxy for a way to say “I’m a bigger fan than you.”

I think fantasy sports fans are underserved by mainstream rules. They’re just crappy and way too arbitrary. Let’s break down my six biggest gripes, and the guide I’ve used to create Sports.ws:

  • Mainstream sites call game play “head to head” because they add up scores for a certain time period and score you against some else in your league. In fantasy football, you’re usually subbing out whoever’s not playing that week; for basketball you’re just picking players that play 4 games instead of 2. Actual good play isn’t rewarded enough.
  • The default categories mainstream rules reward were seemingly selected because they’re available. In basketball, every major site counts shooting percentage for big points. You know who had a high field goal shooting percentage? Shaquille O’Neal: great player, one of the worst shooters in history. Add some value to stats if you use them. Kudos to any site that lets you customize point values, but offer meaningful stat values as a default.
  • For leagues that draft, 99% of mainstream sites steer you towards doing them live, over just a few hours. I’d argue half the fun of a league is in the draft. It’s the one time of the year when everybody is equal, where anybody can win the championship. I’ve done live drafts, and they’re great, but why not at least offer the option to not rush bad picks? To make more trades mid-draft? To not force someone that can’t make it to choose auto-draft? Let leagues customize how they draft players.
  • “Snake Order” drafting has been antiquated since it was invented. It’s a nice idea — give teams that get a first pick in the first round last pick in the next — but in every major sport, talent is not evenly distributed, and the first overall pick always has an even bigger advantage even with the added risk. The math is sound: Make the draft as fair as possible.
  • How many sites let you have a league of more than 12 or 16 teams? Incredibly few. Don’t limit league size if you don’t have to.
  • Team defense is still a thing? Seriously? Let game players identify with people, not teams or concepts.

94Feet.com

Arvydas Sabonis, Finals MVP: The 1995 Site

We had fun that first season, but it was a lot of work to score 82 head-to-head games manually. The next year I set out to automate things with more programming. Simultaneously, I was fortunate enough to forge a sports nerd camaraderie with Caleb, who used Pascal and Hypercard to code the first per-minute simulation. If you play today, you know that Sports.ws’ most unique feature is scoring of every minute of fantasy play.

94Feet.com in 1998


Automated code meant it wouldn’t be much more work to host leagues for others, so I launched a public site at 94feet.com and tried to host multiple leagues. In short, it failed hard. It was absolutely crushed by the interest and I had to shut it down the first season even before it started.

It wasn’t long before I graduated, hated my first job, and quit to move in with Jeffers to try to go pro with a fantasy site.

Sports.ws

I got an offer to buy 94Feet.com in 2000 by a clothing manufacturer with the same name. I sold it for cash plus a huge assortment of amazing basketball clothing. Jeffers and I played around with the domains FinalBuzzer.com and Gametime.ws but ultimately won the Sports.ws domain from the newly minted TLD .ws registrar by convincing them “we are to fantasy sports what .ws is to .com.”

"Office": 1999

We launched a zillion mini-games, and portals for football, international soccer, hockey, and the olympics. We funded the site (and rent) with advertising dollars. Jeffers designed, our other roommate Hooshla coded some real backend stuff, and the rest of League Zero offered up insight and kept our league alive. The site took off and quickly amassed hundreds of thousands of users, but the basketball game was the most effective, successful, and we eventually narrowed the focus on that.

Things I learned quickly:

1) I had serious feature ADHD. I had some luck inventing a few games, but I should have stuck to a slimmer feature-set and communicated with users more.
2) I had no idea what I was doing from a business perspective.

Evolution, The Black Era

The Site in 2004

I had begun a hardcore job (in more ways than one) by 2001, and experimenting full-time wasn’t an option. Jeffers took another crack at a redesign and I coded the version of the game that exists today: 82-game schedule, up to 32 teams per league, per-minute scoring, playoffs with customizable brackets, awards, trash talk, trades, and voting.

By this time, our interests were to address all of the fantasy sports gripes above and to keep our own league (7 seasons in) alive. By focusing on basketball, we kept bugs at a minimum and grew faster than ever. By 2004, we were getting as much traffic and basketball teams as the biggest fantasy sites.

We call the era the black era because of the raw obnoxious black backdrop — it was a design that people complained about later saying “everybody thought I was watching porn at work.” But also, I was focused on so many other projects by then that it took a backseat at a time when it really could have taken the world by storm. In 2006, I turned it to auto-pilot for a season to focus on other things and because I couldn’t find an easy way to make a lot of money staying true to the mission.

The Renaissance

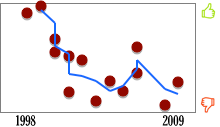
I had a hankering to inject some new ideas into the site for a while, and in 2009 overhauled it to function like it does today. I leveraged the powered of communal sharing to develop organic news feeds generated almost entirely from Tweets by journalists and players. I also broke down the wall between leagues. Chatter, sharing, and profile building kept users occupied between games. I also added one of my favorite features, the “props” buttons.

Facebook Has Likes: Sports.ws Has Everything Else

Gestures have long been a fascination of mine — user actions that require very little effort, unlike adding a comment. If you’re a user, you see these props available on draft picks, trades, and news items, but they’re built to be completely dynamic so that some day (cross fingers), you can choose your own amongst your leagues.

Exodus and The Good Point

The site has grown every year since 2008, but apart from playing with my own league, I don’t have the passion to support it the way it needs. Complicated rules mean complicated documentation, and that requires technical help. The millions of teams on the site need the TLC of someone that understands them.

I’ve had offers to buy the site to strip it for parts, mostly to mine the email lists for gambling offers. I’ve refused them to date because this is still the ultimate side passion project and the kid with the sports page would kick my ass if I killed that.

As of the first of this year, I’ve decided to sell to digital media juggernaut The Good Point. From their press release:

What does it mean for regular Sports.ws users?
We all know that you’ve been loyal to Sports.ws for years. Now the site that you’ve been so committed to over that time will be evolving from the No. 1 fantasy basketball game on the internet, to the No. 1 most engaging fantasy sports community period. We have professional credentials here at TheGP, one of the many perks of working in news, and a team of 50+ writers both past and present delighted to give this site and this community the attention it deserves. The brilliant Patrick Butler and his team of former Sports.ws developers have created this gem that we’ve all grown to love, now we at TheGP have come together to accept the baton and complement that dream.”

Austin Kent and the staff of The Good Point have, first, been users themselves for many years. Second, the sensibilities of their content is right in line with the anti-establishment nature of the site. Lastly, the final piece of the puzzle to making the site really shine is good, original content and I’m excited to see what they can offer as I enter my role solely as end-user for the first time.

If you’re a user, I owe a huge amount of thanks to you for supporting and using the site, for sticking with it through experiments and tech hiccups, and for being willing to take a chance on the oddball rules before there was documentation. I don’t take that commitment lightly. In return, I’m hoping that handing it over to passionate people that will only improve upon it brings you solace.

I look forward to playing year after year… if just to take down Jeffers and his Manu Ginobili fascination.

The Cost of Competing – or – Why Olympic Weightlifting is More Hardcore Than You Think

12 Aug 2012

One of my favorite parts of the Olympics is all the hypothetical pub-challenges I exchange with my friends.

“If you had 8 years to train and were executed if you didn’t medal, which event would you train for?”

My Answer: Sailing

“Which should be the first sport to go? And replaced with what?”

Answer: Ping-Pong, Tug-of-War

“If you had to sleep with a random Olympian in a certain sport, which sport would you pick?”

Pragmatic Answer: Field Hockey or Soccer; Gross Answer: Gymnastics; Fun Answer: Boxing

I like to arm myself with numbers when I come to a bar fight (go ahead, judge me), so I thought I’d try to settle the whole Is Equestrian Elitist? debate.

For all summer medalists since 1988, here’s how much money the average person from the medal winning countries earn:

Sport
Average Country Income
Equestrian $38,302
Triathlon $37,189
Cycling $33,635
Sailing $33,557
Softball $33,375
Rowing $33,367
Archery $31,500
Handball $30,900
Aquatics $30,277
Tennis $30,203
Table Tennis $29,933
Canoe / Kayak $28,794
Field Hockey $27,844
Volleyball $27,200
Judo $26,418
Shooting $26,325
Fencing $25,615
Basketball $25,445
Modern Pentathlon $24,606
Taekwondo $24,385
Track and Field $24,058
Gymnastics $23,234
Badminton $23,058
Wrestling $21,734
Football $20,936
Boxing $20,346
Weightlifting $17,675

In my mind, these seem incredibly intuitive across the board. The more gear, luxuries, and training space required, the better richer athletes and countries do.

But it doesn’t stop there. Even within disciplines, the numbers are fairly unsurprising. Look at Track and Field:

Track Event
Athlete Income
Pole Vault $30,910
110m Hurdles $30,583
Javelin Throw $30,350
20km Race Walk $29,857
3000m $28,850
Decathlon $27,311
100m Hurdles $27,264
1500m $26,823
50km Walk $26,175
4x400m Relay $26,089
Shot Put $26,008
4x100m Relay $25,992
20km Walk $25,600
Heptathlon $25,400
100m $25,280
High Jump $25,213
Triple Jump $23,825
800m $23,412
Hammer Throw $22,731
Discus Throw $22,086
200m $21,482
3000m Steeplechase $21,167
Marathon $21,081
Long Jump $21,023
400m $20,867
400m Hurdles $19,686
10000m Walk $18,800
10000m $16,655
5000m $14,860

There are a few outliers but if something requires stuff or special training, athletes from richer countries tend to do better.

So does this mean you can you compare one sport to another? One might look at these numbers and correlate race stereotypes with how difficult a sport is; I’d argue some countries do better because of the economics more than the body mechanics and genes. And in general, I think the lower the average medalist income, the more badass the medal is. Lower incomes mean less barriers mean bigger competitor pools.

Summary: If you’re starting from scratch and want a medal, don’t go into weightlifting. 10 of the bottom 17 spots are weightlifting events.

The process:

  • To be clear, the averages come from macro-level country averages, not individual people.
  • The income is not actually income but GDP per capita based on purchasing power parity (PPP) (source: CIA/World Bank, 2007-2011). Since accurate disposable income numbers aren’t readily available for all countries, I like this estimate for guessing how much buying power each potential athlete has to buy javelins, bikes, horses, and doping kits.
  • The income is a mean, not a median, in the hopes uneven distribution does play a factor.
  • Retired sports and retired countries were ignored.

The Legendary Chicago Sports Moustaches

6 Feb 2012

Chicago was named 2011′s Most Moustache Friendly City in America. Civilians across Chicagoland can grow as much facial hair as their follicles support, now with less ridicule than ever.

If you’re a fan of Chicago sports, you may be aware of the amazing string of championships rung up by moustachioed coaches and managers. The last nine major sports championships won by Chicago teams were helmed with lip fuzz.

Exactly how much better are moustachioed managers? The breakdown since 1980, when moustaches emerged regularly:

Team


Bulls

545-193 W-L
.738 pct
Postseasons: 9 (100%)
Championships: 6
792-1006 W-L
.440 pct
Postseasons: 12 (52%)
Championships: 0

Blackhawks

370-294 W-L
.557 pct
Postseasons: 8 (80%)
Championships: 1
721-728 W-L
.498 pct
Postseasons: 13 (62%)
Championships: 0

Bears

146-118 W-L
.553 pct
Postseasons: 8 (47%)
Championships: 1
119-121 W-L
.496 pct
Postseasons: 4 (27%)
Championships: 0

White Sox

1151-1067 W-L
.519 pct
Postseasons: 3 (21%)
Championships: 1
1447-1391 W-L
.510 pct
Postseasons: 2 (11%)
Championships: 0

Cubs

569-619 W-L
.479 pct
Postseasons: 1 (11%)
Championships: 0
1859-2018 W-L
.479 pct
Postseasons: 5 (21%)
Championships: 0

City Total

1980-2011

2781-2291 W-L
.548 pct
Postseasons: 29 (33%)
Championships: 9
4875-5264 W-L
.480 pct
Postseasons: 25 (26%)
Championships: 0

Every team has performed better when led by moustache. The exception are the Cubs who do equally poorly in any condition, but they have Billy Goat, Black Cat, Vance Law, Steve Bartman and a whole bunch of other curses to offset the magic of the moustache.

While it’s obvious from the numbers that Moustaches are Moneyball v2.0, take a look how every Chicago sports champion did it:

Champion Team Coach/Manager Moustache?

2010 Blackhawks
Joel Quenneville
The Walrus

2005 White Sox
Ozzie Guillen
The Swamp Otter

1998 Bulls
Phil Jackson
Coiffed Beard

1997 Bulls
Phil Jackson
The Italian Plumber
plus Soul Patch

1996 Bulls
Phil Jackson
The Chevron

1993 Bulls
Phil Jackson
The Lampshade

1992 Bulls
Phil Jackson
The Selleck

1991 Bulls
Phil Jackson
The State Trooper

1985 Bears
Mike Ditka
Hurricane Ditka

1963 Bears
George Halas
Clean

1961 Blackhawks
Rudy Pilous
Clean

1946 Bears
George Halas
Clean

1943 Bears
Hunk Anderson
and Luke Johnsos
Clean

1941 Bears
George Halas
Clean

1940 Bears
George Halas
Clean

1938 Blackhawks
Bill Stewart
Clean

1934 Blackhawks
Tommy Gorman
Clean

1933 Bears
George Halas
Clean

1920 Staleys
George Halas
Clean

1917 White Sox
Pants Rowland
Clean

1908 Cubs
Frank Chance
Clean

1907 Cubs
Frank Chance
Clean

1906 White Sox
Fielder Jones
Clean

And for fun, the top 50 Chicago teams since 1980:

Year Team Record Pct. Postseason Coach/Manager Hair Stache?
1985 Bears 15-1 0.938 Won Super Bowl Mike Ditka Moustache
1996 Bulls 72-10 0.878 Won NBA Championship Phil Jackson Moustache
1986 Bears 14-2 0.875 Lost Quarterfinals Mike Ditka Moustache
1997 Bulls 69-13 0.841 Won NBA Championship Phil Jackson Moustache
1992 Bulls 67-15 0.817 Won NBA Championship Phil Jackson Moustache
2001 Bears 13-3 0.812 Lost Quarterfinals Dick Jauron Clean
2006 Bears 13-3 0.812 Lost Super Bowl Lovey Smith Clean
1998 Bulls 62-20 0.756 Won NBA Championship Phil Jackson Beard
2011 Bulls 62-20 0.756 Lost Eastern Conference Finals Tim Thibodeau Clean
1988 Bears 12-4 0.750 Lost NFC Conference Championship Mike Ditka Moustache
1991 Bulls 61-21 0.744 Won NBA Championship Phil Jackson Moustache
1987 Bears 11-4 0.733 Lost Quarterfinals Mike Ditka Moustache
2010 Blackhawks 52-22 0.703 Won Stanley Cup Finals Joel Quenneville Moustache
1993 Bulls 57-25 0.695 Won NBA Championship Phil Jackson Moustache
1990 Bears 11-5 0.688 Lost Quarterfinals Mike Ditka Moustache
1991 Bears 11-5 0.688 Lost Wildcard in Playoffs Mike Ditka Moustache
2005 Bears 11-5 0.688 Lost Quarterfinals Lovey Smith Clean
2010 Bears 11-5 0.688 Lost NFC Conference Championship Lovey Smith Clean
1991 Blackhawks 49-23-8 0.681 Lost NHL Division Semi-Finals Mike Keenan Moustache
1983 Blackhawks
1990 Bulls 55-27 0.671 Lost Eastern Conference Finals Phil Jackson Moustache
1994 Bulls 55-27 0.671 Lost Eastern Conference Semifinals Phil Jackson Moustache
2009 Blackhawks 46-24 0.657 Lost NHL Conference Finals Denis Savard, Joel Quenneville Clean, Moustache
1993 Blackhawks 47-25-12 0.653 Lost NHL Division Semi-Finals Darryl Sutter Clean
1984 Bears 10-6 0.625 Lost NFC Conference Championship Mike Ditka Moustache
2005 White Sox 99-63 0.611 Won World Series Ozzie Guillen Goatee
1983 White Sox 99-63 0.611 Lost ALCS Tony LaRussa Clean
1988 Bulls 50-32 0.610 Lost Eastern Conference Semifinals Doug Collins Clean
2002 Blackhawks 41-27-13 0.603 Lost NHL Conference Quarter-Finals Brian Sutter Clean
2011 Blackhawks 44-29 0.603 Lost NHL Conference Quarter-Finals Joel Quenneville Moustache
2008 Cubs 97-64 0.602 Lost NLDS Lou Piniella Clean
2007 Bulls 49-33 0.598 Lost Eastern Conference Semifinals Scott Skiles Clean
1984 Cubs 96-65 0.596 Lost NLCS Jim Frey Clean
1994 White Sox 67-46 0.593 Missed Playoffs Gene Lamont Clean
1996 Blackhawks 40-28-14 0.588 Lost NHL Conference Semi-Finals Craig Hartsburg Clean
2000 White Sox 95-67 0.586 Lost LDS Jerry Manuel Moustache
1990 White Sox 94-68 0.580 Missed Playoffs Jeff Torborg Clean
1993 White Sox 94-68 0.580 Lost ALCS Gene Lamont Clean
1989 Cubs 93-69 0.574 Lost NLCS Don Zimmer Clean
1989 Bulls 47-35 0.573 Lost Eastern Conference Finals Doug Collins Clean
1995 Bulls 47-35 0.573 Lost Eastern Conference Semifinals Phil Jackson Moustache
2005 Bulls 47-35 0.573 Lost Eastern Conference First Round Scott Skiles Clean
1995 Bears 9-7 0.562 Missed Playoffs Dave Wannstedt Moustache
2008 Bears 9-7 0.562 Missed Playoffs Lovey Smith Clean
1994 Bears 9-7 0.562 Lost Quarterfinals Dave Wannstedt Moustache
1995 Blackhawks 24-19-5 0.558 Lost NHL Conference Finals Darryl Sutter Clean
2006 White Sox 90-72 0.556 Missed Playoffs Ozzie Guillen Goatee
1990 Blackhawks 41-33-6 0.554 Lost NHL Conference Finals Mike Keenan Moustache
1992 Blackhawks 36-29-15 0.554 Lost Stanley Cup Finals Mike Keenan Moustache
1998 Cubs 90-73 0.552 Lost LDS Jim Riggleman Clean
2004 Cubs 89-73 0.549 Missed Playoffs Dusty Baker Moustache

If Theo Epstein and Jed Hoyer want to start winning, an obvious solution would be to hand over the 2012 Cubs to ex-Cub Warren Brusstar, but understandably there’s a transition phase.

Should The 27 Club Be a Thing?

25 Jul 2011

This weekend, Amy Winehouse joined the likes of Jimi Hendrix, Janis Joplin, Brian Jones, Jim Morrison, and Kurt Cobain in the tragic 27 Club. Her passing was unfortunate and inspired countless musings on the curse of being 27 and a rock star. Is there a curse? Is there even a pattern? Virtually every mainstream news outlet only offered up lines like this (from WaPo):

And then there was the “27” — rock-and-roll’s most dangerous number.

Dangerous, yes. Most dangerous? A few science blogs have looked at the reason we latch on to the coincidence of these deaths, but there’s virtually nothing on the arithmetic comparing 27 to other ages.

Here’s a breakdown (by age) of the deaths of pop musicians:

The process: I took every performance artist associated with the top 100 songs of each year since 1958, plus the top 30 of each since 1950. Just over 2700 names surfaced, of which 1920 have publicly available birthdays.

Conclusion: Even though the distribution of mortality isn’t normal, 27 doesn’t stick out at all. The 45 Club is even more prolific and includes Freddie Mercury, Nat King Cole, Marvin Gaye, Ricky Nelson, and Vicky Sue Robinson.

But the six that died at 27 were all very well known… perhaps their fame offsets the low count:

The process: I used the size of each artist’s Wikipedia bio as a rough estimate of their popularity. It’s messy, but not entirely inaccurate.

Conclusion: The 27 Club starts looking pretty unique. But, by every definition of outlier and accounting for kurtosis risk, the tragedy is still not a statistically significant blip.

This, combined with the fact that many of these artists may now be more famous because they died young or at 27, implies The 27 Club may be little more confirmation bias of something we want to believe. Tragic in any case.

As a bonus, here are the biggest Wikipedia articles (used in the second chart about) of deceased pop music artists. Interestingly, six of the top 30 were 27:

Artist Date of Death Age at Death Size of Bio (bytes)
1 Michael Jackson June 25, 2009 50 678205
2 Larry Norman February 24, 2008 60 567654
3 Elvis Presley August 16, 1977 42 489759
4 George Harrison November 29, 2001 58 473953
5 Perry Como May 12, 2001 89 459965
6 John Lennon December 8, 1980 40 430026
7 Jimi Hendrix September 18, 1970 27 347781
8 Amy Winehouse July 23, 2011 27 340050
9 Frank Sinatra May 14, 1998 82 334649
10 Brian Jones July 3, 1969 27 274835
11 Freddie Mercury November 24, 1991 45 267406
12 Billy Preston June 6, 2006 59 261701
13 Linda McCartney April 17, 1998 56 242898
14 Marvin Gaye April 1, 1984 45 235208
15 James Brown December 25, 2006 73 235144
16 Nicky Hopkins September 6, 1994 50 233422
17 2Pac September 13, 1996 25 232234
18 Aaliyah August 25, 2001 22 228570
19 Jo Stafford July 16, 2008 90 221186
20 Dusty Springfield March 2, 1999 59 216142
21 Notorious B.I.G. March 9, 1997 24 213507
22 Johnny Cash September 12, 2003 73 212470
23 Kurt Cobain April 5, 1994 27 195379
24 Jim Jones November 18, 1978 47 190806
25 Ray Charles June 10, 2004 73 185208
26 Bing Crosby October 14, 1977 74 182754
27 Frankie Laine February 6, 2007 93 182509
28 Jim Morrison July 3, 1971 27 181778
29 Janis Joplin October 4, 1970 27 176099
30 Louis Armstrong July 6, 1971 71 174824


Most Inspirational Locations for Movie Plots

1 Mar 2011

Finding out where movies are filmed is easy. IMdB and others have comprehensive databases. But a huge proportion of movies are filmed in cities like Los Angeles, Vancouver, and Albuquerque and made to look like they’re set somewhere else. A database of movie plot locations doesn’t exist yet.

Here’s my estimate of how likely each major U.S. city is to be featured in a movie plot:

Population Major Movies Score Pivotal Movies
Washington, DC 20.3x 601723 466 79292016 Mr. Smith Goes to Washington, All the President’s Men, Independence Day, Minority Report, Wedding Crashers
Las Vegas, NV 12.5x 567641 308 46016257 Casino, Ocean’s Eleven, The Hangover, Fear and Loathing in Las Vegas, Rain Main, Con Air, Bugsy
Miami, FL 10.1x 433136 175 28334637 Scarface, Goldfinger, There’s Something About Mary, Bad Boys, Some Like It Hot, Ace Ventura: Pet Detective
San Francisco, CA 7.7x 815358 666 40801201 The Rock, Vertigo, The Maltese Falcon, Interview with the Vampire, Mrs. Doubtfire, Hulk, The Game
Los Angeles, CA 7.1x 3831868 1438 176257698 L.A. Confidential, The Terminator, The Graduate, Pulp Fiction, Die Hard, Beverly Hills Cop, Crash, Blade Runner
Boston, MA 6.6x 645169 229 27621078 The Departed, Good Will Hunting, The Town, Legally Blonde, Mystic River, Gone Baby Gone, The Boondock Saints
New York, NY 4.7x 8391881 4158 255981837 The Godfather, Taxi Driver, Spider-Man, I Am Legend, Midnight Cowboy, Shaft, Annie Hall, Marathon Man, Annie, Big
Baltimore, MD 3.1x 637418 77 12678744 Slience of the Lambs, Kiss Kiss Bang Bang, Enemy of the State, Hairspray, He’s Just Not That Into You
Seattle, WA 2.7x 616627 136 10791529 Sleepless in Seattle, Say Anything…, The Fabulous Baker Boys, The Ring, WarGames, 10 Things I Hate About You
Atlanta, GA 2.7x 540922 68 9325449 Remember the Titans, Mr. and Mrs. Smith, Driving Miss Daisy, Smokey and the Bandit, Drumline
Chicago, IL 2.6x 2851268 567 47411519 The Untouchables, Chicago, Blues Brothers, Ferris Bueller’s Day Off, Home Alone, Backdraft, The Breakfast Club
Memphis, TN 2.4x 676640 54 10511964 Walk the Line, The Blind Side, The Firm, Hustle & Flow
El Paso, TX 2.3x 620456 22 9205186 Kill Bill, No Country for Old Men, Traffic, Glory Road, Viva Villa!
Philadelphia, PA 2.0x 1547297 170 20442335 Philadelphia, Rocky, The Sixth Sense, Unbreakable
Detroit, MI 2.0x 910921 113 11678371 RoboCop, The Crow, 8 Mile, Gran Turino, Grosse Pointe Blank
Denver, CO 1.6x 610345 52 6233118 The Shining, Butch Cassidy and The Sundance Kid, How the West Was Won, Dumb and Dumber
Cleveland, OH 1.4x 431369 56 3914791 Major League, American Splendor, Duplicity, The Rocker
Sacramento, CA 1.1x 466676 30 3277451 Zodiac, Coach Carter, All About Steve, Pink Cadillac, Frankie and Johnnie
San Diego, CA 1.1x 1306300 101 9167137 Traffic, Anchorman, Old School, The Lost World: Jurassic Park
Omaha, NE 1.1x 454731 18 3134616 Up in the Air, About Schmidt, Election, Omaha
Albuquerque, NM 0.9x 529219 24 3100373 Easy Rider, Little Miss Sunshine, Sunshine Cleaning, Young Guns, Albuquerque
Oakland, CA 0.9x 409189 30 2313455 Romeo Must Die, Youth in Revolt, True Crime, Jack the Bear
Portland, OR 0.8x 566143 62 3087745 Goonies, Mr. Brooks, Elephant, Mr. Holland’s Opus
Fresno, CA 0.8x 479918 11 2596661 The Karate Kid, Par II, Thieves’ Highway, Shadow of a Doubt, The Gang’s All Here
Milwaukee, WI 0.8x 605013 22 2954139 Michael Clayton, Mr. 3000, American Movie, Love Actually
Dallas, TX 0.7x 1299542 65 6070769 Places in the Heart, Office Space, Boys Don’t Cry, The X Files
Tucson, AZ 0.7x 543910 35 2507418 Public Enemies, The Matador, Romy and Michele’s High School Reunion, Hamlet 2
Phoenix, AZ 0.7x 1593659 49 6777541 Raising Arizona, Away We Go, Psycho, The Savages
Austin, TX 0.6x 786386 54 2893518 Dazed and Confused, Grindhouse, Road Trip, The Life of David Gale
Louisville, KY 0.6x 566503 20 2037377 The Insider, Stripes, The Return of the Living Dead, Fear Strikes Out
Kansas City, MO 0.5x 482299 12 1554213 Sullivan’s Travels, Caopte, Mad Money, Superman
Houston, TX 0.4x 2257926 65 5395160 Apollo 13, Urban Cowboy, Terms of Endearment, The Right Stuff
Indianapolis, IN 0.3x 807584 19 1637714 Hoosiers, Close Encounters of the Third Kind, Now and Then, The Hudsucker Proxy
Columbus, OH 0.3x 769332 13 1343134 Bye Bye Birdie, The Mothman Prophecies, Traffic, Slience of the Lambs
Oklahoma City, OK 0.3x 560333 7 926619 Thelma & Louise, Elizabethtown, Dead Bang, Christmas on Mars
Nashville, TN 0.2x 605473 60 967440 Coal Miner’s Daughter, Nashville, Hanna Montana: The Movie
Long Beach, CA 0.2x 462604 16 452222 Blood Work, Cutter’s Way, The Star, Our Very Own
Raleigh, NC 0.1x 405612 4 295142 American Hardcore, Bandwagon
San Jose, CA 0.1x 964695 7 423050 Outbreak, The Social Network
Jacksonville, FL 0.1x 813518 5 295307 It Happened One Night, Cocaine Angel
Mesa, AZ 0.04x 467157 5 112190 Suspect Zero, The Marshal of Mesa City, Stage to Mesa City
San Antonio, TX 0.04x 1373668 30 316526 The Alamo, Like Water for Chocolate, San Antonio, Cloak & Dagger
Fort Worth, TX 0.02x 727577 9 98913 The Killer Inside Me, Fort Worth, Texas, Brooklyn & Heaven
Virginia Beach, VA 0.01x 433575 2 32715 The Baxter, The Trouble with Summer
Charlotte, NC 0.003x 709441 5 12827 Shallow Hal, Juwanna Mann

Washington, D.C., for example, is 20.3 times as likely the setting for a movie plot as the average movie (per capita).

The Process

1. For every non-TV movie, I parsed review sites, Wikipedia and IMdB listings, and tried to dynamically assess which cities were referenced or featured in the movie’s plot. Some parsing was easing: Wikipedia references cities like Omaha,_Nebraska and IMdB has a robust list of user-contributed and site-monitored keywords. Other implied references were made using crude natural language processing, trained using primary Wikipedia city and state articles (landmarks were common triggers). I ignored movies that didn’t have any reviews or plot descriptions: about 10,000 made the cut.

2. For each U.S. city/state that occurred in the text (verbatim or implied), I came up with a score for the movie-city or movie-state combo loosely defined by:

Quantity of Ratings x Quality of Ratings x Box Office Performance x Occurrences of City/State Name x Proximity of City/State Keywords to Important Article Words/Beginning of Article x Literal vs. Implied Reference to City/State

I wanted better, more popular movies to weigh more, but not overwhelm more quintessential classics. Rain Man was as critically and commercially successful as any movie, but didn’t top the Las Vegas movies because it took place in other cities too.

3. I added up the score for all U.S. cities with a population of 400,000 or more and sorted by score per capita. Foreign cities were harder to parse because of inconsistent language.

4. All the parsing and scoring was automated and no manual edits were made, so there’s plenty of fuzz in the estimations. The Pivotal Movies were the highest scoring movies associated with each city.

By State

State scores were more abundant, but less precise. A visual interpretation:

Likelihood of US states being the subject/location of a movie plot (per capita).


NFL Quarterback Turnover

6 Feb 2011

Cheering for the Bears requires living and dying by whatever Johnny-come-lately quarterback the franchise decides is the next big thing. New Chicago quarterbacks are common — as it turns out, more frequent than any other NFL franchise since 1980:

Team Yrs Most Played QB Starts Different QBs QBs Per Year
Chicago Bears 31 Jim Harbaugh 60 29 0.94
Cleveland Browns 28 Bernie Kosar 91 26 0.93
Arizona Cardinals 31 Neil Lomax 92 27 0.87
Carolina Panthers 16 Jake Delhomme 71 13 0.81
Dallas Cowboys 31 Troy Aikman 165 25 0.81
Baltimore Ravens 15 Joe Flacco 48 12 0.80
Tampa Bay Bucs 31 Trent Dilfer 76 24 0.77
Atlanta Hawks 31 Chris Chandler 67 24 0.77
Washington Redskins 31 Joe Theismann 83 24 0.77
New Orleans Saints 31 Bobby Hebert 69 23 0.74
Detroit Lions 31 Scott Mitchell 57 22 0.71
San Diego Chargers 31 Dan Fouts 98 22 0.71
NY Jets 30 Ken O’Brien 100 21 0.70
Minnesota Vikings 31 Tommy Kramer 82 21 0.68
Kansas City Chiefs 31 Trent Green 72 21 0.68
St. Louis Rams 31 Jim Everett 100 21 0.68
Oakland Raiders 31 Rich Gannon 67 20 0.65
Philadelphia Eagles 31 Donovan McNabb 135 20 0.65
Miami Dolphins 31 Dan Marino 235 20 0.65
Denver Broncos 31 John Elway 230 20 0.65
Tennessee Titans 31 Warren Moon 139 18 0.58
Buffalo Bills 31 Jim Kelly 160 18 0.58
Indianapolis Colts 31 Peyton Manning 160 18 0.58
Houston Texans 9 David Carr 75 5 0.56
Seattle Seahawks 31 Matt Hasselbeck 124 17 0.55
New England Patriots 31 Tom Brady 143 17 0.55
Cincinatti Bengals 31 Boomer Esiason 118 17 0.55
San Francisco 49ers 31 Joe Montana 131 16 0.52
Pittsburgh Steelers 31 Ben Roethlisberger 98 14 0.45
Jaxsonville Jaguars 16 Mark Brunell 101 7 0.44
New York Giants 31 Phil Simms 148 11 0.35
Green Bay Packers 31 Brett Favre 237 8 0.25

Actors: Who Is Sucking the Fastest?

2 Feb 2011

According to the news, Charlie Sheen’s career is in shambles. He’s facing some unhealthy distractions that may cause him to miss some work, but he’s having fun too. I don’t doubt his short-term work will be limited, but I don’t buy that his long-term prospects are gloomy.

Is Charlie Sheen’s decline the worst in Hollywood? Let’s put the fact that Charlie’s still the face of the biggest sitcom on TV aside and just look at movies to find out.

Using some math, here’s a list of the the actors whose movies are sucking the fastest. Keep in mind that an actor’s “decline” implies they have somewhere to fall from — the better they originally did, the further they have to drop.

1

Vin Diesel
Decline / Year: 4.88
Early Hits:
91 – Saving Private Ryan (1998)
97 – The Iron Giant (1999)
67 – Boiler Room (2000)
Recent Misses:
36 – F&F: Tokyo Drift (2006)
7 – Babylon A.D. (2008)
28 – Fast and Furious (2009)

2

Damon Wayans
Decline / Year: 4.23
Early Hits:
84 – Beverley Hills Cop (1984)
88 – Roxanne (1987)
87 – Hollywood Shuffle (1987)
Recent Misses:
48 – Bamboozled (2000)
9 – Marci X (2003)
9 – Marmaduke (2010)

3

Amanda Seyfried
Decline / Year: 3.67
Early Hits:
75 – Nine Lives (2004)
83 – Mean Girls (2004)
53 – Mamma Mia! (2008)
Recent Misses:
33 – Boogie Woogie (2009
28 – Dear John (2010)
41 – Letters to Juliet (2010)

4

Lindsay Lohan
Decline / Year: 3.22
Early Hits:
79 – The Parent Trap (1998)
88 – Freaky Friday (2003)
83 – Mean Girls (2004)
Recent Misses:
13 – Just My Luck (2006)
17 – Georgia Rule (2007)
7 – I Know Who Killed Me (2007)

5

Barbra Streisand
Decline / Year: 3.18
Early Hits:
92 – Funny Girl (1968)
100 – On a Clear Day… (1970)
91 – What’s Up, Doc? (1972)
Recent Misses:
54 – Mirror Has Two Faces (1996)
38 – Meet the Fockers (2004)
10 – Little Fockers (2010)

6

Orlando Bloom
Decline / Year: 3.10
Early Hits:
92 – Lord of the Rings I (2001)
77 – Black Hawk Down (2001)
96 – Lord of the Rings II (2002)
Recent Misses:
20 – Love / Other Disasters (2006)
45 – Pirates of the Carr. 3 (2007)
38 – New York, I Love You (2010)

7

Billy Burke
Decline / Year: 2.95
Early Hits:
86 – Under the Skin (1997)
78 – Without Limits (1998)
60 – The Independent (2000)
Recent Misses:
15 – Untraceable (2008)
27 – Twilight 2 (2009)
50 – Twilight 3 (2010)

8

Macaulay Culkin
Decline / Year: 2.88
Early Hits:
56 – Uncle Buck (1989)
71 – Jacob’s Ladder (1990)
47 – Home Alone (1990)
Recent Misses:
8 – Getting Even with Dad (1994)
27 – Party Monster (2003)
9 – Sex and Breakfast (2007)

9

Julie Andrews
Decline / Year: 2.70
Early Hits:
100 – The Amer. of Emily (1964)
100 – Mary Poppins (1964)
100 – Thor. Modern Millie (1967)
Recent Misses:
41 – Shrek the Third (2007)
58 – Shrek 4 (2010)
17 – The Tooth Fairy (2010)

10

America Ferrera
Decline / Year: 2.64
Early Hits:
83 – Real Wom. Have Curves (2002)
86 – Steel City (2005)
79 – Sis of the Traveling Pants (2005)
Recent Misses:
11 – Towards Darkness (2008)
61 – The Dry Land (2010)
14 – Our Family Wedding (2010)

11

Derek Luke
Decline / Year: 2.62
Early Hits:
79 – Antwone Fisher (2002)
84 – Pieces of April (2003)
81 – Friday Night Lights (2004)
Recent Misses:
36 – Miracle at St. Anna (2008)
26 – Madea Goes to Jail (2009)
50 – Notorious (2009)

12

David Spade
Decline / Year: 2.61
Early Hits:
94 – Light Sleeper (1992)
65 – Reality Bites (1994)
1994 – PCU (1994)
Recent Misses:
12 – The Benchwarmers (2006)
18 – Grandma’s Boy (2006)
10 – Grown Ups (2010)

13

Chris Klein
Decline / Year: 2.38
Early Hits:
92 – Election (1999)
59 – American Pie (1999)
63 – We Were Soliders (2002)
Recent Misses:
20 – The Good Life (2007)
8 – New York City Serenade (2007)
10 – Stright Fighter (2009)

14

Diane Keaton
Decline / Year: 2.10
Early Hits:
100 – The Godfather (1972)
100 – Sleeper (1973)
100 – Love and Death (1975)
Recent Misses:
5 – Because I Said So (2006)
8 – Mama’s Boy (2007)
22 – Mad Money (2008)

15

Katherine Heigl
Decline / Year: 2.07
Early Hits:
80 – That Night (1992)
96 – King of the Hill (1993)
60 – 100 Girls (2000)
Recent Misses:
14 – The Ugly Truth (2009)
29 – Life as We Know It (2010)
11 – Killers (2010)
Check it out, Carlos is only 35!

35

Charlie Sheen
Decline / Year: 1.25
Early Hits:
81 – Ferris Bueller’s Day Off (1986)
86 – Platoon (1986)
78 – Wall Street ( 1987)
Recent Misses:
36 – Scary Movie 3 (2003)
37 – Scary Movie 4 (2006)
40 – Due Date (2010)

The Process

1. Rotten Tomatoes derives a score out of 100 for every movie based on the percentage of favorable reviews. They’re used for this exercise, unedited.

2. The decline per year and graphs were auto-generated. The decline is the slope coefficient for a standard linear regression, the graphs use a moving average for the trend line.

3. Only the top 500 actors are included (the 500 whose movies have earned the most at the box office), and actors must have starred in 10 movies.

Caveat

Since rate is a function of time, actors with a shorter career will have a much more volatile number. That means actresses like Julie Andrews and Diane Keaton have to work extra hard to sully all those 100′s from the beginning of their career.

The Extended List

The 50 Fastest Falling

Rank Actor Fall per Year
1 Vin Diesel -4.88
2 Damon Wayans -4.23
3 Amanda Seyfried -3.67
4 Lindsay Lohan -3.22
5 Barbra Streisand -3.18
6 Orlando Bloom -3.10
7 Billy Burke -2.95
8 Macaulay Culkin -2.88
9 Julie Andrews -2.70
10 America Ferrera -2.64
11 Derek Luke -2.62
12 David Spade -2.61
13 Chris Klein -2.38
14 Diane Keaton -2.10
15 Katherine Heigl -2.07
16 Lena Headey -1.99
17 Marlon Wayans -1.89
18 Jackie Earle Haley -1.80
19 Ice Cube -1.76
20 Kate Beckinsale -1.75
21 Cher -1.63
22 Martin Lawrence -1.60
23 James Garner -1.57
24 Bette Midler -1.55
25 Jet Li -1.53
26 Breckin Meyer -1.50
27 John Corbett -1.49
28 Rufus Sewell -1.45
29 Nia Long -1.36
30 Amy Ryan -1.34
31 Carrie Fisher -1.33
32 Steve Coogan -1.29
33 Gael Garcia Bernal -1.26
34 Charlie Sheen -1.25
35 Randy Quaid -1.24
36 Ron Livingston -1.22
37 Paul Bettany -1.22
38 Edward Norton -1.21
39 Keira Knightley -1.20
40 Rutger Hauer -1.18
41 Arnold Schwarzenegger -1.18
42 Sarah Michelle Gellar -1.17
43 Seth Green -1.14
44 Jonathan Rhys Meyers -1.13
45 Jennifer Lopez -1.09
46 Sean Connery -1.08
47 Anna Paquin -1.06
48 Hugh Grant -1.05
49 Meg Ryan -1.03
50 Winona Ryder -1.03

The 50 Fastest Rising

Rank Actor Rise per Year
1 Jeremy Renner 3.11
2 Jesse Eisenberg 2.4
3 Jason Bateman 1.97
4 Steve Carell 1.88
5 Vera Farmiga 1.62
6 Jonah Hill 1.59
7 Adam Scott 1.57
8 Tobey Maguire 1.56
9 Kristen Wiig 1.48
10 Piper Perabo 1.47
11 Zach Galifianakis 1.44
12 Chris Evans 1.42
13 Ashton Kutcher 1.37
14 James Franco 1.34
15 Abigail Breslin 1.25
16 Jason Schwartzman 1.23
17 Cillian Murphy 1.21
18 Johnny Knoxville 1.20
19 Kristen Stewart 1.16
20 Ryan Phillippe 1.02
21 Josh Brolin 1.02
22 Angelina Jolie 1.01
23 Ryan Gosling 0.99
24 Liv Tyler 0.96
25 Mandy Moore 0.92
26 John Krasinski 0.87
27 Guy Pearce 0.86
28 Rhys Ifans 0.86
29 Leslie Mann 0.86
30 Casey Affleck 0.85
31 Heath Ledger 0.84
32 Tea Leoni 0.83
33 Eva Mendes 0.81
34 Hilary Swank 0.81
35 Kal Penn 0.80
36 Viggo Mortensen 0.79
37 Jim Carrey 0.72
38 Jeffrey Wright 0.71
39 Paul Walker 0.71
40 Adrien Brody 0.68
41 Ryan Reynolds 0.67
42 Maggie Gyllenhaal 0.63
43 Taraji P. Henson 0.62
44 Thomas Haden Church 0.59
45 Clive Owen 0.54
46 Christian Bale 0.53
47 Mark Ruffalo 0.53
48 Dakota Fanning 0.49
49 Benjamin Bratt 0.48
50 Peter Sarsgaard 0.42

NFL Roulette

24 Jan 2011

Boys’ weekend challenge: “We need a way to be able to bet on anything at anytime during this weekend’s games.”

Restrictions: we’re all flying to the same place, there are four conference semis to watch over two days, everybody needs to be able to participate at any level at any time, we’ve only got a five hour flight with in-flight Wifi to invent the game.

Challenge accepted.

Download every play from the regular season, create a board with payouts that offset the probability of each event not occurring.


292-1 payout for predicting an overturned penalty? Don’t mind if I do!

The Creeping Ubiquity of Movie Sequels

7 Dec 2010

The sequel has been around forever. It’s natural for an audience to want the stories they like to continue. When storytelling became marketable through print in the 18th century, sequels became a reliable stream of income. When movies emerged a century ago, the sequel seemed like a logical fit, both as a storytelling device and as a money-maker.

So how many movies made are actually sequels? Here’s my raw estimate:

Source: IMDb/Wikipedia/Semantic Indexing of Web

Here’s how that compares to the number of all movies:

Source: IMDb/Wikipedia/Semantic Indexing of Web

Sequel-making is on the rise, but it’s not keeping up with overall movie releases. The cost of production is dropping, so new movies are being released all the time. More and more aren’t sequels. Yet — people are watching sequels more than ever.

Originality in 1984

The Top Grossing Movies of 1984 (Domestic)
1. Beverly Hills Cop Original $235M
2. Ghostbusters Original $229M
3. Indiana Jones and the Temple of Doom Sequel (2) $180M
4. Gremlins Original $148M
5. The Karate Kid Original $91M
6. Police Academy Original $81M
7. Footloose Original $80M
8. Romancing the Stone Original $77M
9. Star Trek III: The Search for Spock Sequel (3) $76M
10. Splash Original $70M

In 1984, original screenplays dominated the box office. Even Indiana Jones and the Temple of Doom and Star Trek III were based on original screenplays despite being sequels. These are stories that aren’t based on anything except the imagination of the screenwriters’ and producers’ imagination. Not books, not comics, not video games, not old TV shows (except Star Trek).

The top 10 isn’t an anomaly either. Other hugely successful originals in the top 25 included Purple Rain, Amadeus, Tightrope, Revenge of the Nerds, Breakin’, Bachelor Party, Red Dawn, the Terminator, the Killing Fields, and Places in the Heart (among others).


Originality in 2007

The Top Grossing Movies of 2007 (Domestic)
1. Spider-Man 3 Sequel (3) $337M
2. Shrek the Third Sequel (3) $323M
3. Transformers Based on TV $319M
4. Pirates of the Caribbean: At World’s End Sequel (3) $309M
5. Harry Potter and the Order of the Phoenix Sequel (5) $292M
6. I Am Legend Based on Book $256M
7. The Bourne Ultimatum Sequel (3) $227M
8. National Treasure: Book of Secrets Sequel (2) $220M
9. Alvin and the Chipmunks Based on TV $217M
10. 300 Based on Comic $211M

Fast forward 23 years. Not a single movie in the top 10 is based on an original idea. Every one is the continuation of a movie franchise, or an adaptation of a book, an amusement park ride, or a reboot of a TV show.


Looking at Sequel Money for All Years

For lots of reasons — built-in audience, existing marketing streams — sequels make more money than non-sequels. Even if they take up a smaller percentage of overall movies made, they’re a much safer financial bet for studios than original movies.

The shift between 1984 and 2007 is dramatic, but is it a continuing trend? To see exactly how often these studios are going the “safe” route, I looked at revenue for the top 50 grossing (domestic) movies of each year since 1980. (The top 50 seemed like a good cut-off since 65% of 2010′s movie revenue has come from the top 50 movies. That number has been as high as 80% in recent years).

The Process – Instead of manually tabulating what movies are sequels and what aren’t (that would take forever), I set up semantic structures based loosely on IMDb‘s and Wikipedia‘s movie pages, then analyzed a combination of keywords, similar web links, and related metatags (Wikipedia, for instance, allows entries to have a “next” or “previous” in the series). A spot-check revealed a very accurate categorization — even with the subtleties — although I’m sure it’s not perfect. An example: Batman Forever was categorized a sequel, but Batman Begins a remake.

Broken down by percentage:

For another time: the yellow original section in the last five years is more than 70% book, comic, TV, and video game adaptations.

What’s Wrong with the Creep?

Sequels are profitable. Embracing this new incrementalism makes sense for studios, and you can’t fault them for sticking with what works. The ubiquity of this logic was even the basis for the satire of Hamlet 2.

There are more movies than ever to see. So what’s the problem? If I want to want some schlocky big-budget sequel, I should be able to do so without derision, right? There’s nothing wrong with going to see whatever I want!

Wrong. The internet is making it easier to stream obscure movies that weren’t available a few years ago. But there are only a limited number of full-sized theaters. The movie-going experience is something unique that hasn’t been fully replicated at home yet. Until it is, the movies that make money will flood the theaters first, and it will be more and more difficult for you to find original movies to see on the big screen and be seen in their intended original art form. Will there ultimately be a backlash and shift? Not until the market dictates it. And you can bet that Disney will continue to pump out hundreds of millions in marketing to guarantee their expensive investments like Pirates of the Caribbean are seen before anything else. Some say that sequels can be original but I think they’re recognized with a lot of awards because there’s a lack of mainstream alternatives.

One scary scenario: studios start behaving like pharmaceutical giants. 10-15 years ago, Big Pharma started making super profits from its blockbusters in a very similar way to movies do today. Pharma in one of the most profitable industries in the U.S. has spawned two trends: more money is being spent on marketing than R&D and government lobbying is growing like crazy. (I’d argue that, although government involvement is to blame for some of this; it’s a result of lobbying and not proactive anti-trust measures).

Liken Pharma R&D to movie originality, and lobbying to media promotion and studio PR. If in 10 years, the movie industry mirrored the pharmaceutical industry of today, we’ll all be slaves to monster sequels and 3D eye-rapings.

The size of home TVs and entertainment systems is going up and the cost is going down (whether that’s a good thing is worth another post). So at least the original stuff will find an audience eventually, even if it’s not on a 50 foot screen. Social media could play a role in helping indie gems bubble up to popularity. I personally think the most likely catalysts to derail the sequel gravy train are activist studios with less financial focus like Participant Productions.

But until then, there are unofficially 86 big budget movie sequels in production and no end in sight.

At least there’s a good chance I’ll get to see There Will Be Blood 2: The Legend of H.W.’s Black Gold.

The Origins of TV Show Creators

26 May 2010

A friend and I wanted to settle a stupid bet.  He said alumni from our alma mater Wesleyan had created more active TV shows than any other academic institution.  I argued it was probably USC.  Turns out we were both wrong.

Here’s the breakdown for TV program creators (developers where appropriate) by undergraduate education:

Notes:

  • Only active non-reality, non-game shows are counted
  • Fractions come from shows with multiple creators or creators with multiple places of origin
  • Grad schools are not counted (USC ran away with this one)
  • Some shows don’t make the cut because info isn’t widely available

And just for grins… by home state, province, or country:

The sample set is pretty small, but some of these shows are clearly influenced by the stereotypes of their creator’s school or home.